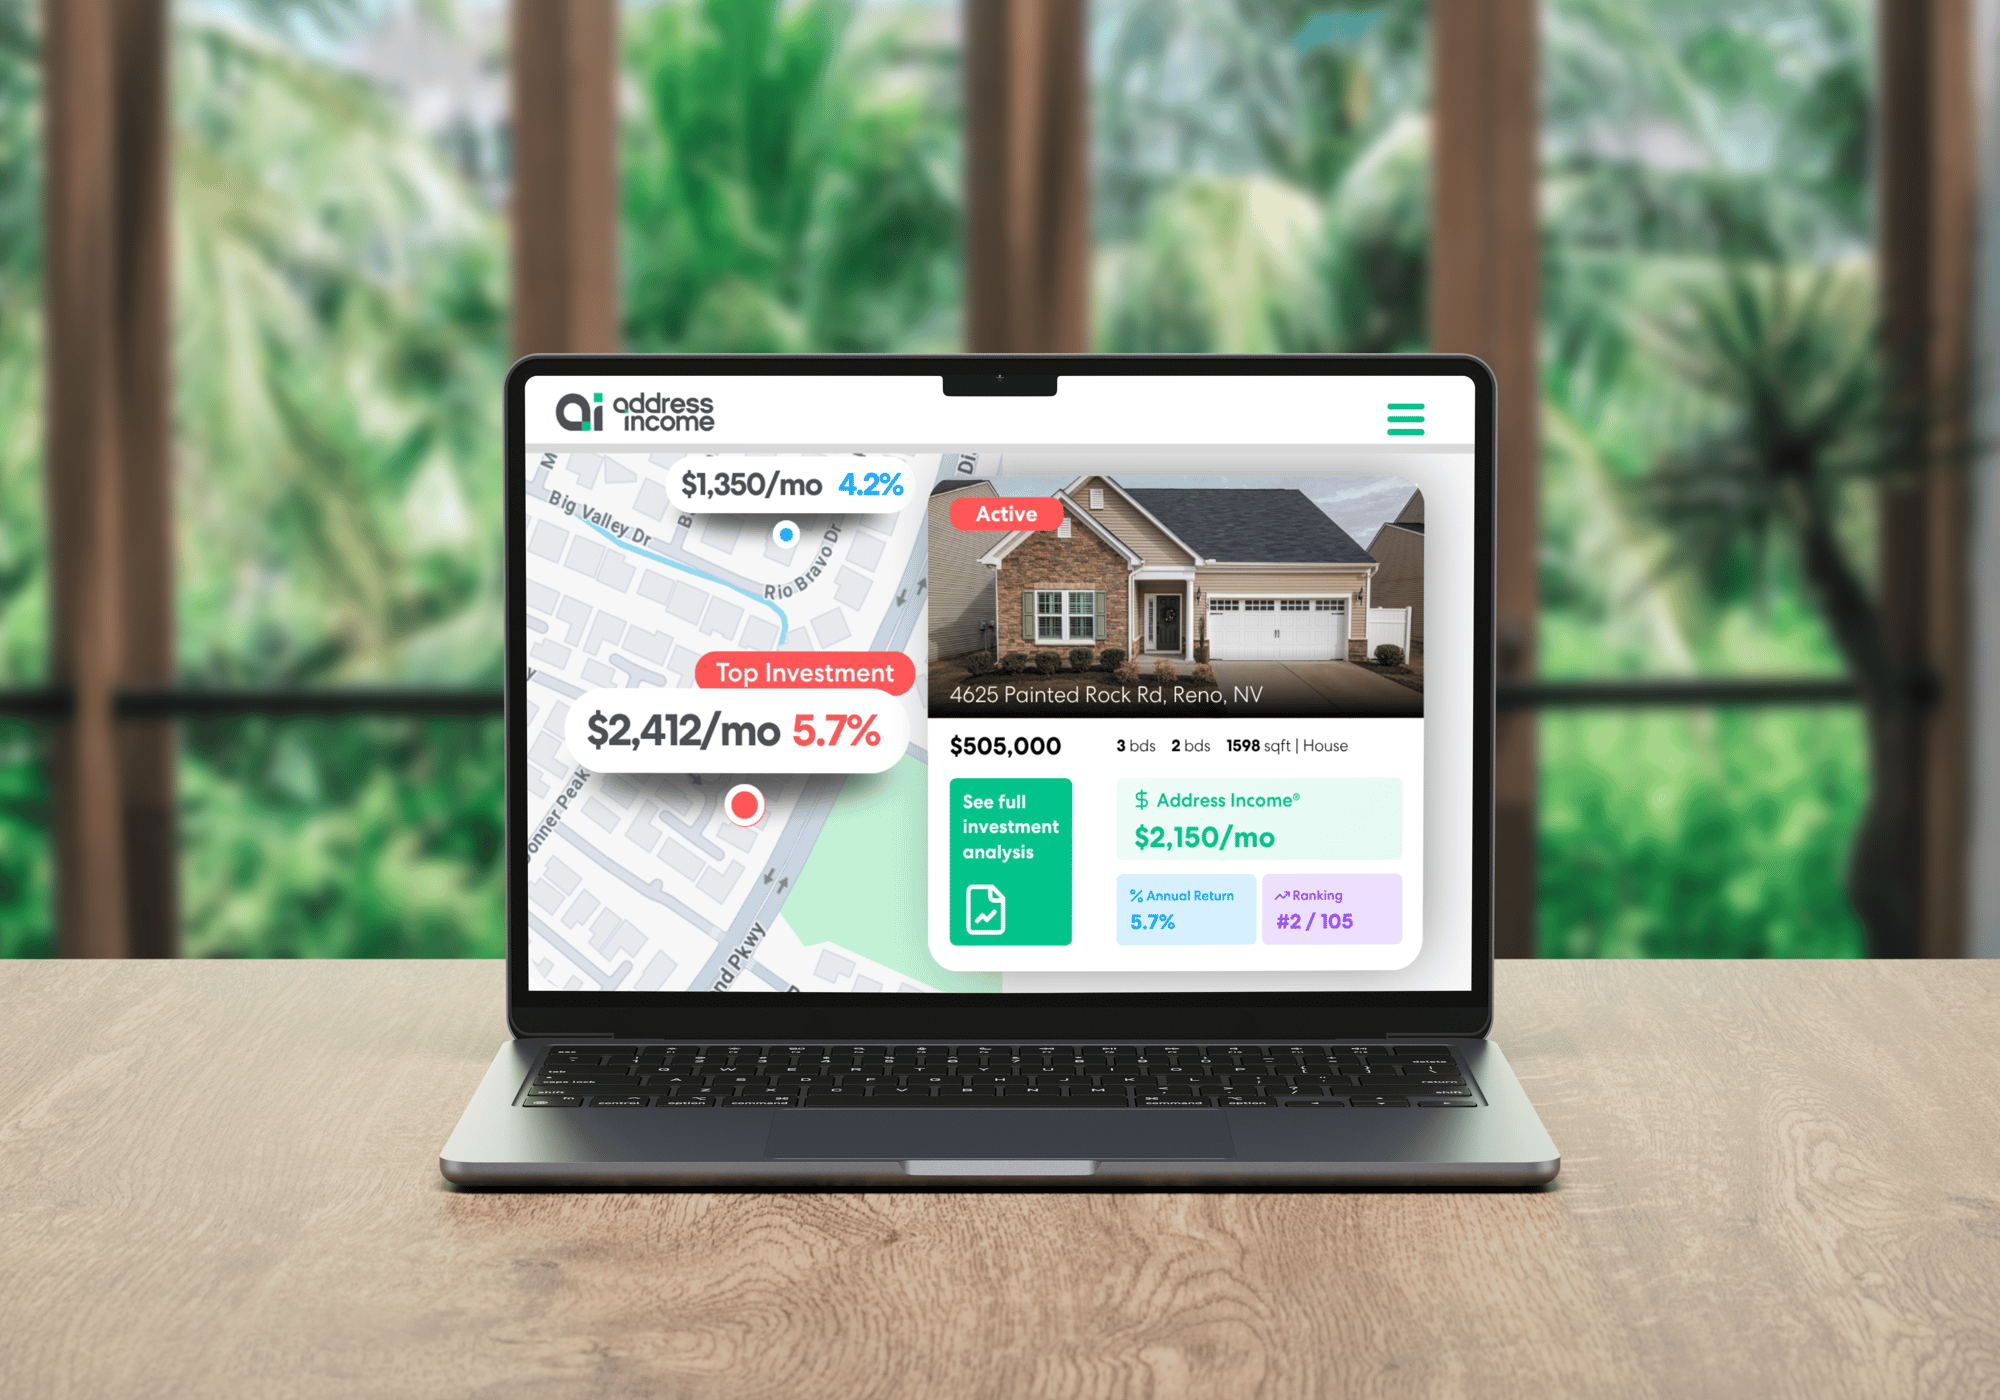
Real Estate Investing in Less Than Five Minutes
No books. No conferences. No gurus. Just math and analytics.
What used to take months of research—from projections to underwriting—is now handled for you. Address Income analyzes every listing market‑wide daily, estimates returns, and presents cash flow, cap rate, and customizable financial metrics in a clean search interface. Both clients and agents can find top investments in minutes and download investor‑grade reports instantly.
-
Proprietary "Address Income" metric
-
Single property investment reports for any property within minutes
-
Daily market-wide property analysis
-
Rent comps, cap rates, cash flow
-
Multifamily fully integrated
-
Accessible by clients + usable by agents
-
Market‑wide pre-analysis:
-
Turnkey metrics: cash flow, cap rate, projected value-add returns viewable instantly
-
Multifamily Integrated: agents and clients share the same powerful tools
-
Instant reports: customizable PDFs, downloadable in minutes
-
Trusted data: projections and comps verified by our on-market Reno agent-analysts

.png)
How to calculate net monthly income or "cash flow". The money metric.
|
The property's net monthly income. We simply named it, Address Income®.
|
How to calculate annual return or "cap rate". The financial metric.
A fast way to compare one property to another.
-
Formula: Annual Income ÷ Purchase Price = Cap Rate
-
Cap rate tells you the annual return on the initial investment.
-
It’s the key to spotting which deals stand out.
-
The higher the cap rate, the better the return on your investment.
Analyze every property in the market like Wall Street "find the best deal". This is where the magic happens.
|
.png)
See investment insights at scale from an entire market analyzed.
|
Homes with lower investment returns Homes with mid level returns Homes with the highest investment potential |
.png)
Here is a look at total market calculations. Our "behind the scenes"
Every Home
We run numbers for every home on the market
Side by Side
Compare by investment performance
Market Tracking
Across neighborhoods and price points
|
Ready? Engage and Invest Smarter You're five minutes in — now it's time to take action. Free Property AnalysisRequest analysis of any home on the market Expert AdvisorsTalk to someone who knows your neighborhood and goals Best PropertiesGet matched with top performers, updated daily |
Connect with a Local Reno Expert
You'll be matched with an Address Income advisor who understands the market, investment potential, and your goals, whether you're buying a home, rental property, or multifamily asset. Fill out the form below to get started.
.png)